
Unsurprisingly, P8 gaps have increased between 2019 and 2022. We anticipated that before last week’s results were released by the Department for Education. What is interesting to interrogate the data release is: just how much is the increase, and is it uniform across schools?
How much has it increased by? Quite a lot. The P8 gap (whether measured at school level or nationally) has increased by 25% since 2019 and is the largest gap since the P8 measure was introduced in 2016. Because of changes to measures, it is more difficult to compare further back but the indications are that COVID-19 has eroded the gains narrowing attainment gaps in secondary schools that have been made since the introduction of the pupil premium in 2010.
Is the increase uniform across schools? Not at all. It is not the case that schools in general have seen the same gap increase since 2019. The 2019 gap data is actually a very poor predictor of schools’ attainment gaps in 2022…
On average, mainstream secondary schools had a P8 gap of 0.6 in 2022
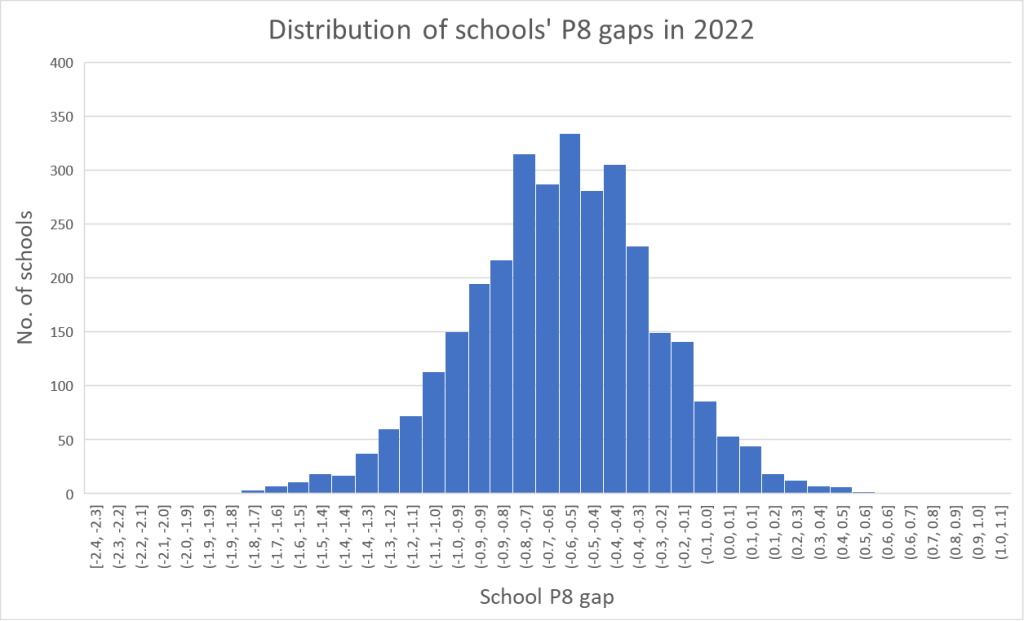
There are approximately 3,300 mainstream secondary schools in England. P8 data is usually unavailable for around 150 of them. In 2022, the Department for Education recorded an average 170 pupil P8 scores for each school, 44 of which were for students identified as FSM6 (eligible for free school meals now or in the last six years). The average gap between FSM6 and non-FSM6 P8 scores in each school was 0.6. This is an increase of 0.12 (or 25%) from the average school P8 gap in 2019, which was 0.48. (Interestingly, the percentage of pupils identified as FSM6 has decreased from 26.5% to 25.5
Schools have not experienced similar changes in the P8 gap
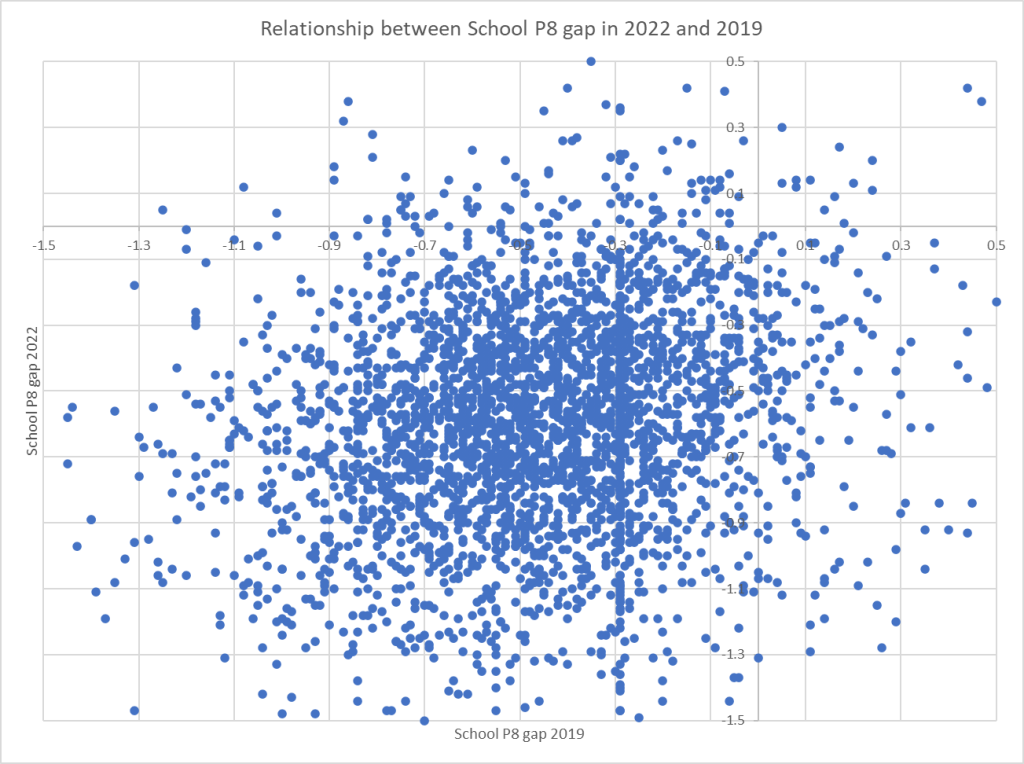
It is obvious to those working in schools, but the impact of COVID on attainment varies enormously by school. The data backs this up. If all schools had been similarly impacted by COVID-19, we might expect a fairly uniform increase to the gap across the school population. There would be a strong relationship between school’s previous performance and their performance now. The scatterplot does show a bit of a correlation (an upward trend in the scatterplot from the bottom left-hand corner to the top right). But it clearly demonstrates that some schools will large gaps in 2019 have small gaps in 2022 and vice-versa. There is a large variance – although the average gap increase is 0.12, most schools did not come close to this.
At a national level, the P8 gap has increased from 0.52 to 0.65 between 2019 and 2022.
As a final comment, note that so far we’ve been talking about the average P8 gap by school. The P8 gap can also be measured at national level, by comparing the national average P8 score for FSM6 students and non-FSM6 students. In both 2022 and 2019, the national gap was higher than the average school gap. Since 2019, it has increased by a similar amount (0.13, or 26%). The reason these averages aren’t the same is an interesting (but complicated) story in itself…